
The third graders recently completed a math unit on data and graphing. They learned about how to complete a survey, how to count votes with a tally chart, and how to display the results with various types of graphs. In order to demonstrate their understanding of graphs, students worked together in groups to complete a graphing project. First, they came up with a question to ask their classmates, usually asking them to determine their favorite in a certain category. Next, they collected data by surveying their classmates. Finally, they worked together to create a poster with multiple types of graphs (bar graphs, pictographs, and line plot graphs) to display their findings.
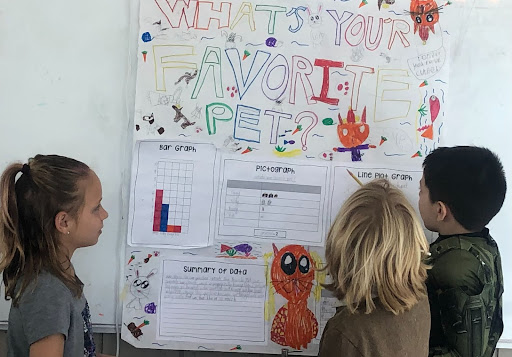
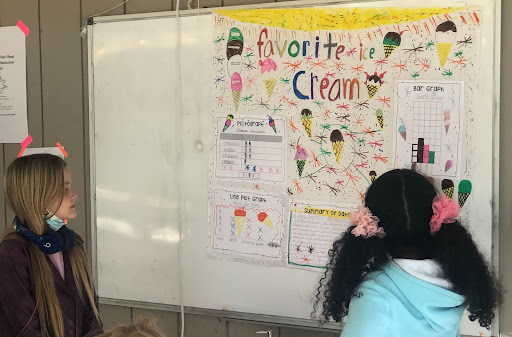


Not only did the third graders show their understanding of the math standards, they also practiced the important skills of listening, communication, compromise, and collaboration that comes along with being a good team member.
#SaklanAcademic

You must be logged in to post a comment.